
Lead Follow-Up Metrics Every Service Business Should Track
If no one is aware of what occurs once a lead enters the CRM, a service company may receive hundreds of inquiries and yet lose money. A missed call can go unanswered. A quotation might be sent, but it’s never looked at again. After one effort, a sales representative can conclude that the prospect is not interested. The consumer is already in conversation with another provider.
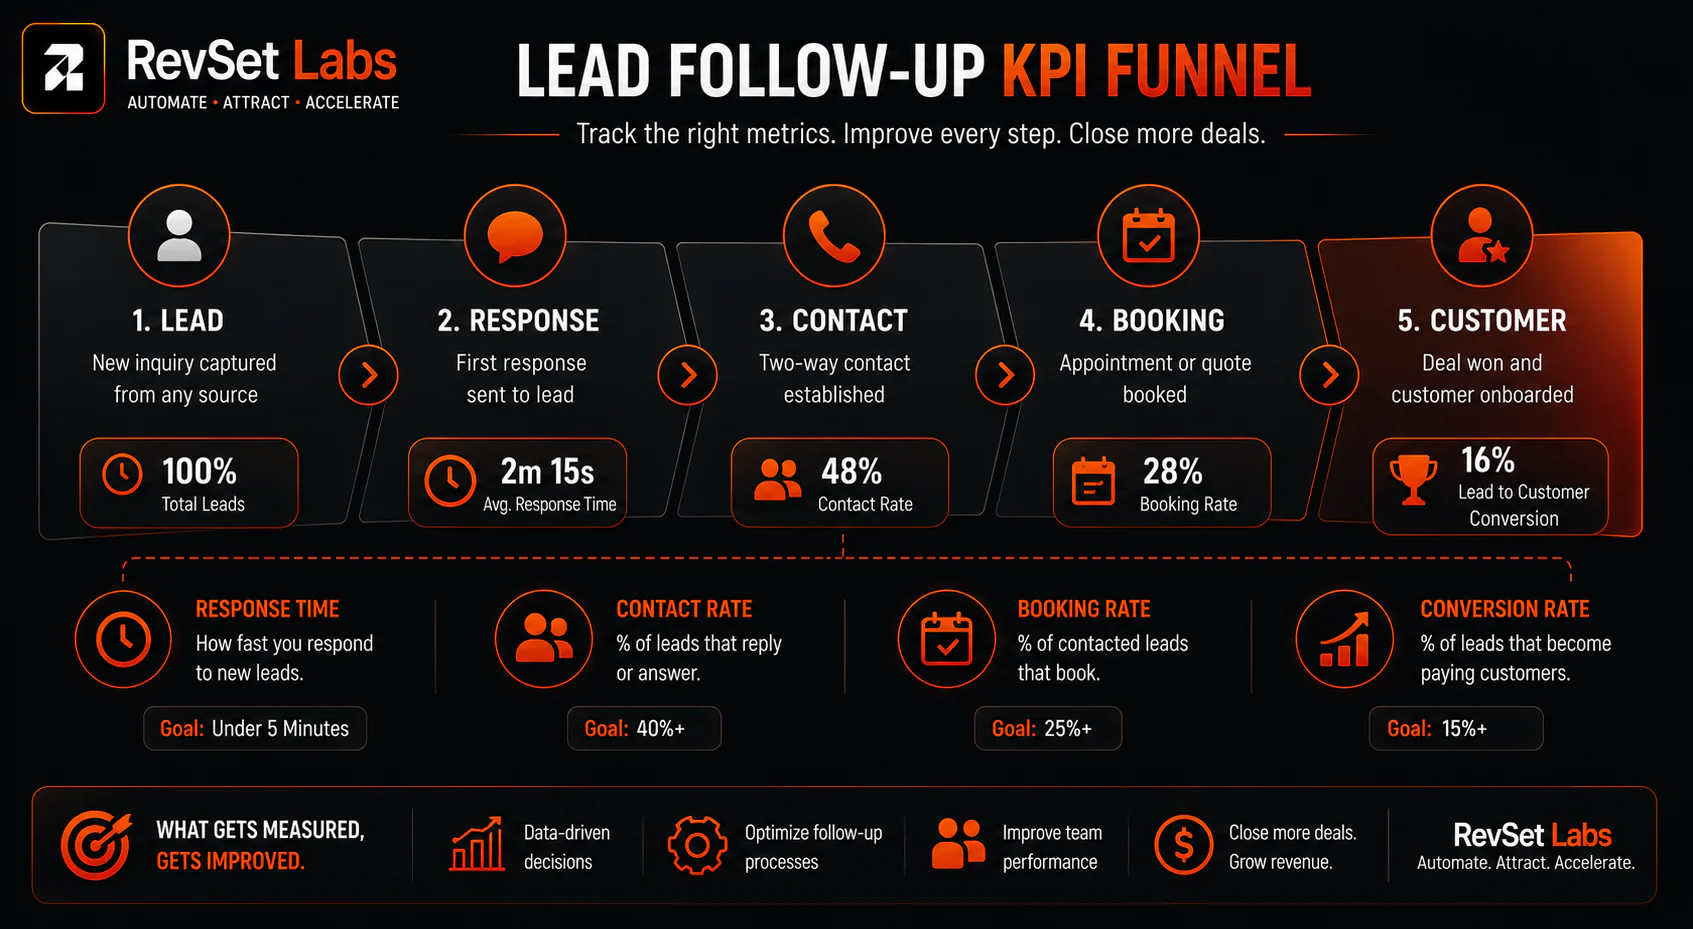
Lead follow-up metrics are important for this reason. They transform follow-up from an ambiguous sales task into a manageable team task.
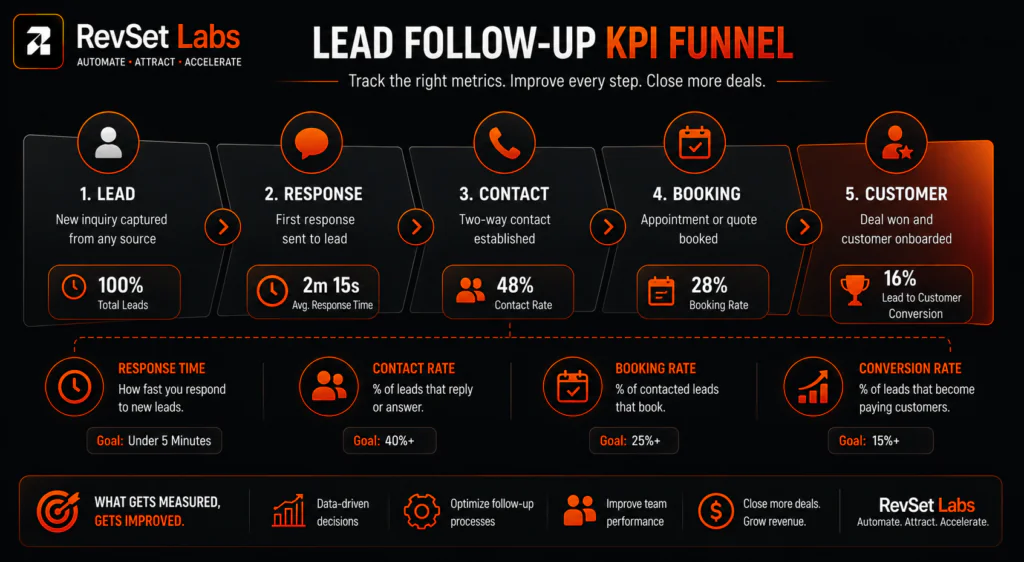
The quantity of calls or messages delivered is not the most helpful lead follow-up metric that any service company should monitor. You must be aware of the team’s response time, the frequency with which leads are contacted, the number of discussions that result in appointments, and the point at which prospects cease to advance in the pipeline.
RevSet Labs, follow-up is not a collection of sales activity, but rather a revenue process. Making representatives “do more follow-up” is not the aim. It is to ensure that the business can determine whether the process generates income and that the appropriate lead receives the appropriate action at the appropriate time.
Why Lead Follow-Up Metrics Matter for Service Businesses
Because demand is sometimes time-sensitive, service firms face a particularly challenging follow-up issue. Before selecting one, a person in need of emergency plumbing, HVAC repair, roofing, dental care, legal assistance, or a local contractor may get in touch with many companies.
Lead quality is not always the issue if your team takes a long time to reply. It might be a lack of ownership, slow response times, bad routing, or irregular follow-up schedules.
Conversion rates were more than eight times greater when incoming prospects were reached within five minutes than when contact occurred later, according to InsideSales’ 2021 lead response study. Over 5.7 million incoming leads and 55 million sales activities from more than 400 organizations were included in the study.
Lead response metrics and lead follow-up metrics are helpful in this situation. Rather than asking, “Are we following up?” managers may inquire:
- How fast are we reacting?
- What proportion of leads get a genuine try?
- In reality, how many leads do we reach?
- How many discussions result in reservations?
- Which lead sources have the highest conversion rates?
- How much time does it take to close?
- Where are the lost leads going?
10 Lead Follow-Up Metrics Every Service Business Should Track
1. Lead Response Time
Lead response time is the time between a lead being created and the first meaningful follow-up attempt.
This should be one of the first figures examined for a service company. Since a few very slow replies might skew an average, the median response time is frequently more informative.
Monitor response times by location, lead source, representative, business hours, and after-hours times.
Because delayed responses might lower conversion prospects, HubSpot defines average lead response time as the amount of time salespeople take to reply to a new sales lead and advises measuring it.
From the standpoint of RevSet Labs, avoid setting a response-time goal that your operating system is unable to meet. The response SLA must be taken into consideration when designing routing and alerts for leads that come from Google Ads, online forms, Facebook, phone calls, and live chat.
(For a full breakdown of how to set up this tracking in your CRM, see How to Measure Lead Response Time in Your CRM.)
2. Follow-Up Rate
A simple question is addressed by follow-up rate: what proportion of new leads are really followed up with?
Formula:
Follow-Up Rate = Leads Followed Up With ÷ Total New Leads × 100
Let’s say a roofing firm aggressively follows up with 425 of the 500 inquiries it receives each month. There is an 85% follow-up rate.
There is more to the remaining 15% than merely an administrative problem. It stands for prospective income that was never discussed in a legitimate sales interaction.
Missed leads, unassigned leads, CRM process issues, and capacity issues may all be found using the follow-up rate.
3. Contact Rate
Contact rate measures how often your team actually reaches a lead and has a two-way interaction.
Formula:
Contact Rate = Leads Successfully Contacted ÷ Leads Followed Up With × 100
This is not the same as the follow-up rate.
Even while a call attempt, voicemail, automated SMS, or email may be considered an action, it does not guarantee that the prospect was contacted.
For example:
- 500 leads generated
- 450 receive at least one attempt
- 225 result in an actual conversation
There is a 50% contact rate and a 90% follow-up rate.
Examine timing, channels, caller ID reputation, message relevancy, and the quantity of tries if the follow-up rate is high but the contact rate is low. It is also necessary to compare contact rates by source. While purchased leads might need to be contacted more quickly or persistently, referral leads might be simpler.
The fact that many businesses made insufficient attempts to get in touch with incoming prospects was another finding from earlier InsideSales research, which emphasizes the need of tracking real contact rather than presuming that outreach activity equates to engagement.
4. Reply Rate
Reply rate measures how many prospects respond to a follow-up message.
Formula:
Reply Rate = Leads Who Reply ÷ Leads Sent a Message × 100
This is one of the best sales follow-up KPIs to monitor for SMS, email, WhatsApp, or similar channels.
A poor response rate might mean:
- The message is rather general.
- There is no obvious call to action.
- Timing is bad.
- The message is very lengthy.
- The sender is unknown to the lead.
- After intent has cooled, the company is reaching out to leads.
Reply rate should not be used as a stand-alone indicator of success. Even with a large number of responses, a message may not result in many appointments. What follows the response is the crucial question.
5. Booking Rate
Booking rate measures the percentage of leads that schedule a consultation, appointment, inspection, estimate, or service call.
Formula:
Booking Rate = Leads That Booked ÷ Qualified or Contacted Leads × 100
Give a consistent definition of the denominator. While a legal business would compute consultation bookings based on qualified leads, a plumbing company might compute bookings based on contacted leads.
The booking rate is 35% if 200 qualifying leads are reached and 70 of them schedule appointments.
This measure indicates if follow-up is indeed generating a future step.
From RevSet Labs’ point of view, do not quickly increase message volume if contact rates are strong but booking rates are low. Examine qualifications, provide clarification, schedule availability, scripts, concerns, and the transition between automated and human representatives.
6. Stage Conversion Rate
Stage conversion shows how effectively leads move from one CRM stage to the next.
New Lead → Contacted → Qualified → Booked → Completed → Quote → Won
Formula:
Stage Conversion Rate = Leads Moving to Next Stage ÷ Leads Entering Current Stage × 100
Because it indicates where the process breaks down, this is one of the most important KPIs to monitor for lead conversion follow-up.
A funnel with 90% follow-up, 55% contact, 35% book, 80% attend, and 40% of completed appointments becoming clients is a helpful illustration. Between contact and booking, there can be the biggest potential.
7. Average Follow-Up Attempts
Average follow-up attempts measure how many meaningful outreach attempts are made before a lead books, converts, or is marked unresponsive.
Formula:
Average Follow-Up Attempts = Total Follow-Up Attempts ÷ Leads Receiving Follow-Up
Keep track of this by results rather than simply a single average.
You could find that although lost leads sometimes only get one try, booked leads usually get three.
This does not imply that a certain quantity of messages should be sent to each lead automatically. The lead source, urgency, customer choice, and service type should all be reflected in the follow-up cadence.
A missed call lead can be worthy of a prompt SMS and callback. Several discussions over several weeks may be necessary for a high-consideration business inquiry.
8. Lead Source Performance
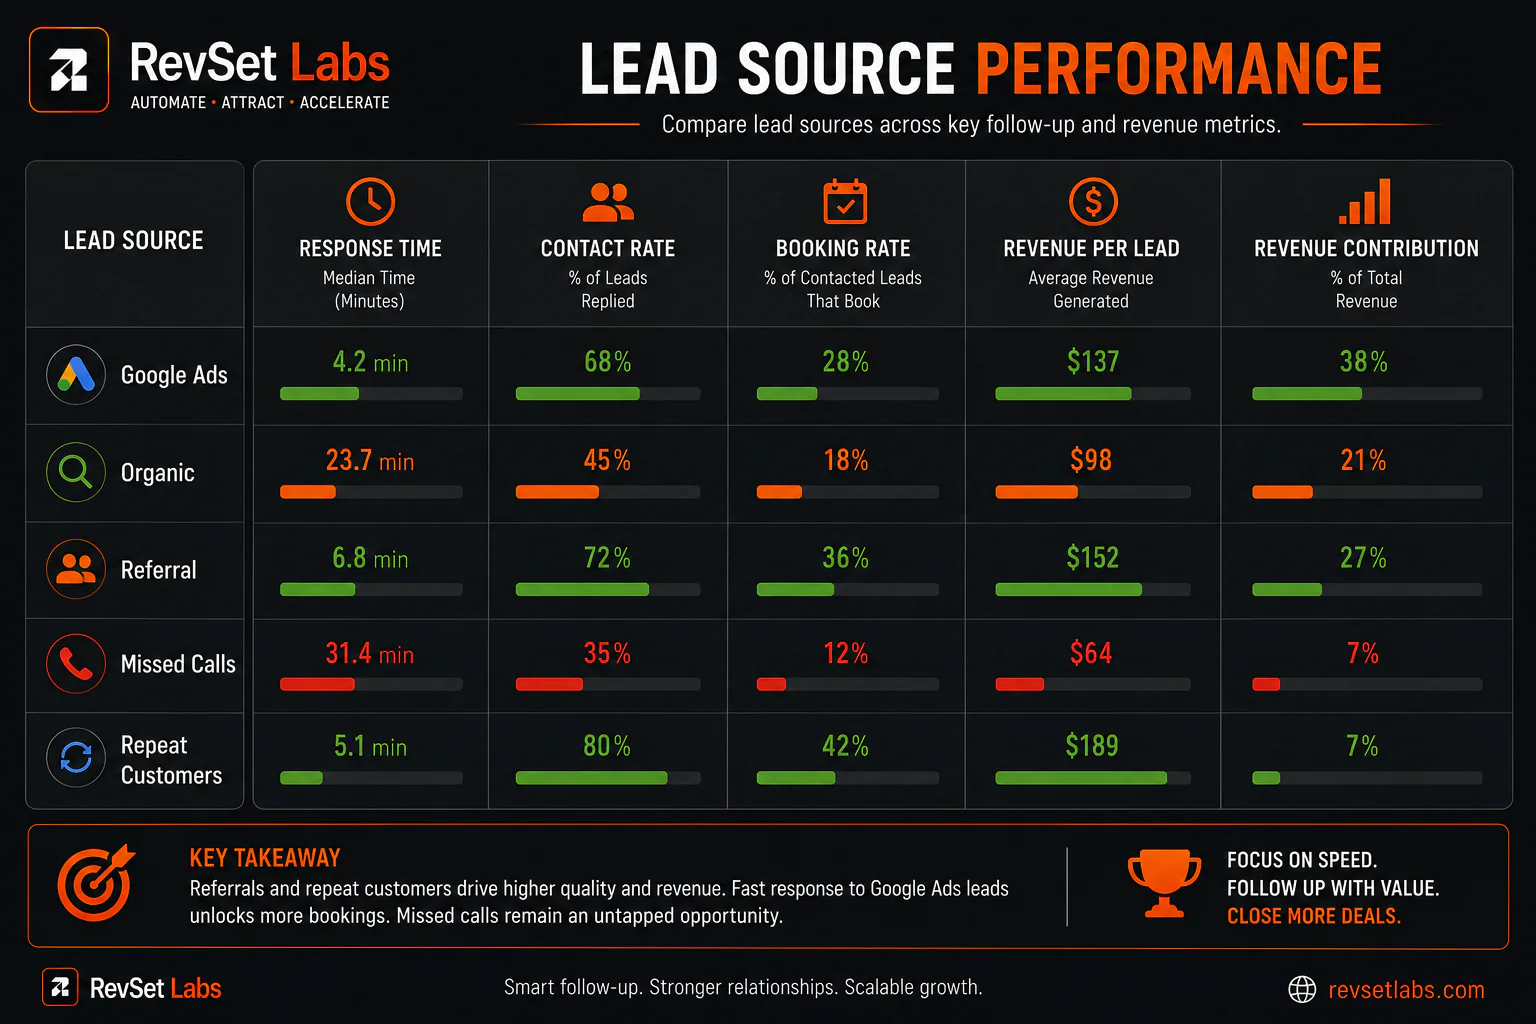
Lead source performance connects follow-up activity to the channel that generated the lead.
Monitor lead volume, response time, contact rate, booking rate, stage conversion, time to close, and income for every source.
This avoids a typical error: evaluating marketing channels only based on lead volume.
A referral channel that generates 60 leads with a 30% booking rate can be more beneficial than a channel that generates 300 leads with a 5% booking rate.
Operational issues may also be shown by lead source performance. Even if both sources enter the same CRM, the routing mechanism may require attention if referral leads wait two hours while Google Ads leads are reached in three minutes.
(See our full guide on Best Follow-Up Timing by Lead Source for source-specific benchmarks.)
9. Time to Close and Sales Velocity
Time to close measures how long it takes a lead to move from initial enquiry to a won customer.
Track:
- Median time to close
- Average time to close
- Time to close by lead source
- Time to close by service
- Time to close by representative
- Time spent in each pipeline stage
By taking into account the speed at which qualifying opportunities become revenue, sales velocity goes one step further.
If follow-up speeds up but the time to closure doesn’t alter, there could be a deeper pipeline issue. The company has further proof that their follow-up procedure is effective if both reaction time and stage velocity increase.
These measures are made simpler by contemporary CRM reporting. Lead response time, lead journeys, call results, email reply rates, and completed activities are all reported by HubSpot.
10. Missed Lead Rate
Missed lead rate shows the percentage of leads that receive no meaningful follow-up within the defined service-level window.
Formula:
Missed Lead Rate = Leads Not Followed Up Within SLA ÷ Total Leads × 100
Consider this a measure of revenue risk.
A company may have a 20% missed lead rate if notifications are not getting to the appropriate person, leads are not being assigned, there is no procedure for after-hours inquiries, or representatives are overworked.
From RevSet Labs’ point of view, reporting missed leads at the end of the month is not the only objective. While you still have time to get them, your CRM should make them available.
How to Build a Lead Follow-Up Metrics Dashboard
A useful dashboard does not need 30 charts. Start with a small set of dashboard KPIs.
Top row: New leads, median response time, follow-up rate, missed lead rate.
Middle row: Contact rate, reply rate, booking rate, average follow-up attempts.
Bottom row: Stage conversion, time to close, revenue by source, CAC by source.
The important rule is to connect activity metrics to outcome metrics.
How to Measure Lead Follow-Up Performance Without Overcomplicating It
For smaller service businesses, the best KPIs for the lead follow-up process are often simple.
Start with five:
- Median lead response time
- Follow-up rate
- Contact rate
- Booking rate
- Lead-to-customer conversion rate
Add stage conversion, time to close, source-level performance, and CAC after the data is trustworthy.
Don’t use shaky CRM data to create a complex dashboard. Reports will give false confidence if representatives fail to regularly document call results, lead phases, or booking status.
Instead of depending on disjointed activity counts, HubSpot’s sales monitoring guidelines provide unified activity and pipeline data to help managers find bottlenecks.
Follow-Up Rate vs Conversion Rate: What Is the Difference?
The follow-up rate inquires:
“Did we attempt to engage the lead?”
The conversion rate inquires:
“Did the lead take the desired next step?”
A company may have a 10% conversion rate and a 95% follow-up rate. Although the staff is working on the leads, it’s possible that not enough of them are being converted.
A different company may have a 25% conversion rate and a 70% follow-up rate. This implies that while the method could be successful when leads are worked, too many leads are being overlooked.
To comprehend the real issue, you need both figures.
Consistent criteria for significant activities and conversions are also emphasized in Google’s current Analytics guidelines, which helps coordinate CRM and marketing reports.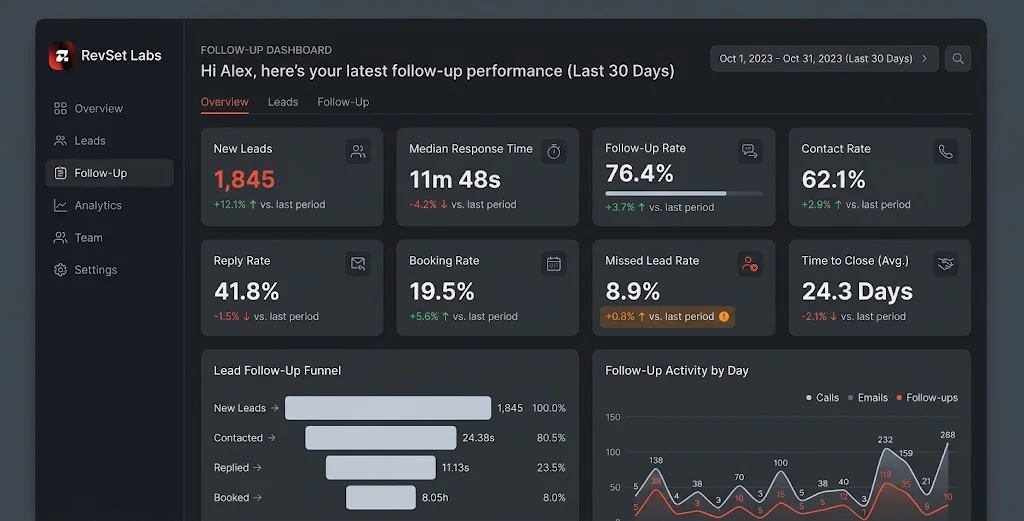
Final Thoughts
In the end, the metrics that link activity and speed to client results are the primary follow-up metrics that every service company should monitor. Different aspects of the tale are revealed by response time, follow-up rate, contact rate, reply rate, booking rate, stage conversion, follow-up efforts, source performance, time to close, missed lead rate, and acquisition cost.
A reliable, consistent measuring method is the priority.
The strategy of RevSet Labs is straightforward: respond to leads quickly, follow up consistently, demonstrate ownership, and track the results of each interaction. You may stop speculating about where income is leaking and begin addressing the precise step that is creating the issue when CRM information reveals the whole journey.
FAQs
What are the most important lead follow-up metrics for a service business?
Lead response time, follow-up rate, contact rate, booking rate, stage conversion, and lead-to-customer conversion rate are among the most crucial indicators. When combined, they demonstrate the effectiveness with which leads transition from inquiry to income.
What is a good lead response time?
High-intent inquiries should often receive a response as soon as feasible, while a decent response time varies depending on the service and lead source. Monitoring the median response time makes it easier to see delays that an average could conceal.
What is the difference between contact rate and reply rate?
Your team’s ability to successfully reach a lead through two-way communication is measured by contact rate. The number of prospects who reply to a message delivered by SMS, email, or WhatsApp is known as the reply rate.
How do you calculate booking rate?
The booking rate is the number of qualifying or contacted leads divided by the number of leads that make an appointment, multiplied by 100. When comparing performance, make sure the denominator remains constant.
How many follow-up attempts should a business make?
Since follow-up cadence should be based on lead source, urgency, service kind, and customer desire, there is no one-size-fits-all figure. To find out what trends lead to reservations, track average attempts by result.
Which lead follow-up metrics should small businesses track?
The median response time, follow-up rate, contact rate, booking rate, and lead-to-customer conversion rate are the five KPIs that small firms can begin with. Once CRM data is trustworthy, more sophisticated metrics may be applied.
How can a business identify where leads are being lost?
To compare the movement from new lead to contacted, qualified, booked, finished, quoted, and won, use stage conversion reporting. A significant decline between two phases typically indicates a particular process bottleneck.
How can CRM reporting improve lead follow-up performance?
CRM reporting unifies pipeline phases, conversion outcomes, follow-up activities, and reaction timeframes into a single view. Teams may use this to find lost leads and address issues before chances pass them by.
Turn Your Follow-Up Data Into Revenue
Knowing your lead follow-up metrics is only useful when the numbers lead to action. If leads are being missed, responses are slow, or prospects are dropping between pipeline stages, your follow-up system may be costing you revenue.
RevSet Labs helps service businesses build faster lead response, consistent follow-up, smarter routing, and measurable CRM workflows so fewer opportunities fall through the cracks.
Ready to find where your revenue is leaking? Run the Revenue Leak Scorecard with RevSet Labs