
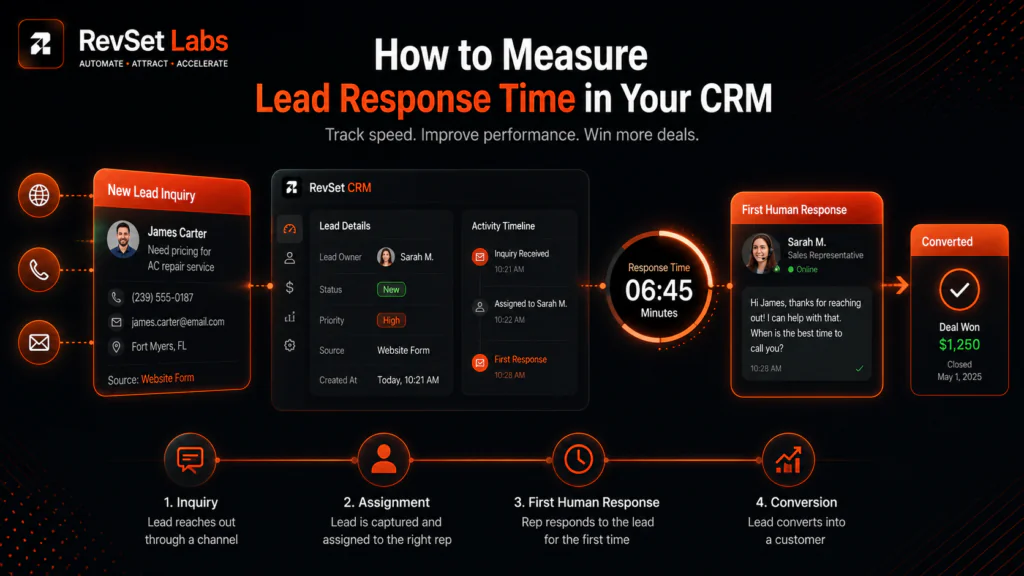
How to Measure Lead Response Time CRM
Most businesses know they should respond to new leads quickly. Far fewer can answer a more important question:
How quickly are we actually responding?
That distinction matters. Because that is the declared SLA, a sales manager could assume the team responds within five minutes. On the other hand, the CRM can display something quite different. Without any significant human follow-up, leads can be left unassigned, languish in a shared mailbox, or get an automatic acknowledgement.
It is challenging to determine whether your speed-to-lead strategy is effective without accurate measurement.
RevSet Labs frequently sees companies attempt to reduce response times before they have established what they are truly monitoring. As a result, the dashboard is filled with figures that appear helpful but don’t truly reflect the customer’s experience.
A more complex CRM isn’t always the answer.
It begins with a precise definition, consistent timestamps, a trustworthy lead response time formula, and reporting that distinguishes between internal CRM activity and actual customer involvement.
This guide describes how to measure lead response time in your CRM, including which fields are required, how to compute the metric, how to set up reporting, and what a good lead response dashboard should really display.
What Is Lead Response Time?
Lead response time is the amount of time between a customer’s inquiry and the business’s first meaningful attempt to engage that customer.
For example:
At 10:02 AM, a potential customer enters an online form.
At 10:07 AM, a salesperson calls.
The time it takes to respond is:
5 minutes.
The computation appears straightforward, but choosing which events to start and stop the clock is a challenging task. Before creating a report, that term must be decided upon. If not, two teams using the same CRM data may claim entirely different response times.
The Lead Response Time Formula
The basic formula is:
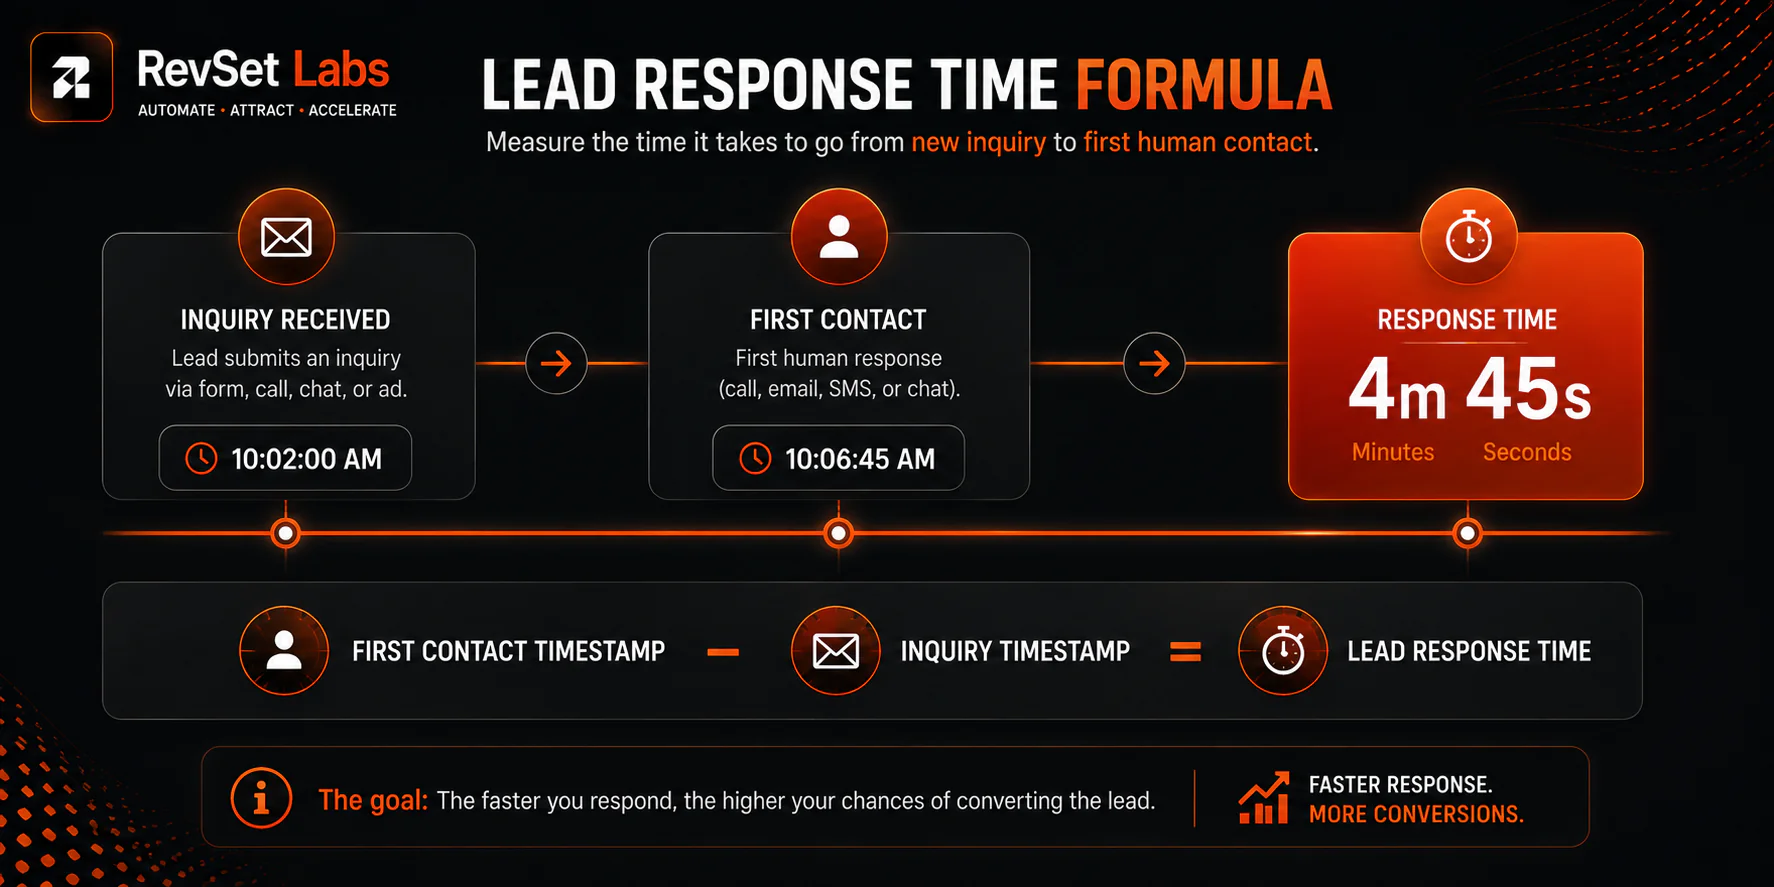
Lead Response Time = First Contact Timestamp − Lead Creation Timestamp
Example
Lead generated through a “Request a Demo” submission on the price page in RevSet Labs CRM (HubSpot):
10:02:00 A.M.
When a RevSet Labs SDR finished a live phone call with the prospect and verified qualification, it was the first relevant interaction that was documented:
10:06:45 a.m.
Time of response:
4 minutes 45 seconds
Instead of having sales reps do this manually, the CRM can do it automatically if you’re measuring hundreds or thousands of leads. However, there is a crucial divergence.
Lead Creation Isn’t Always the Same as Inquiry Time
A CRM record may be created several minutes after a customer actually submits an inquiry.
Example
10:00 AM – Customer submits website form
10:01 AM – Integration sends data to CRM
10:03 AM – CRM creates lead record
10:08 AM – Sales representative calls
The reported response time is five minutes if your CRM begins at 10:03 AM.
It was actually eight minutes from the customer’s point of view.
When response-time goals are expressed in minutes, this distinction becomes significant.
To ensure that your response metrics accurately represent the buyer experience rather than system delay, RevSet Labs advises you to always anchor your SLA clock to the earliest trustworthy customer-facing query timestamp rather than the CRM record creation time.
Which CRM Fields Do You Need?
You don’t need dozens of fields to build useful response-time reporting.
A well-designed setup can begin with a small group of standardized fields.
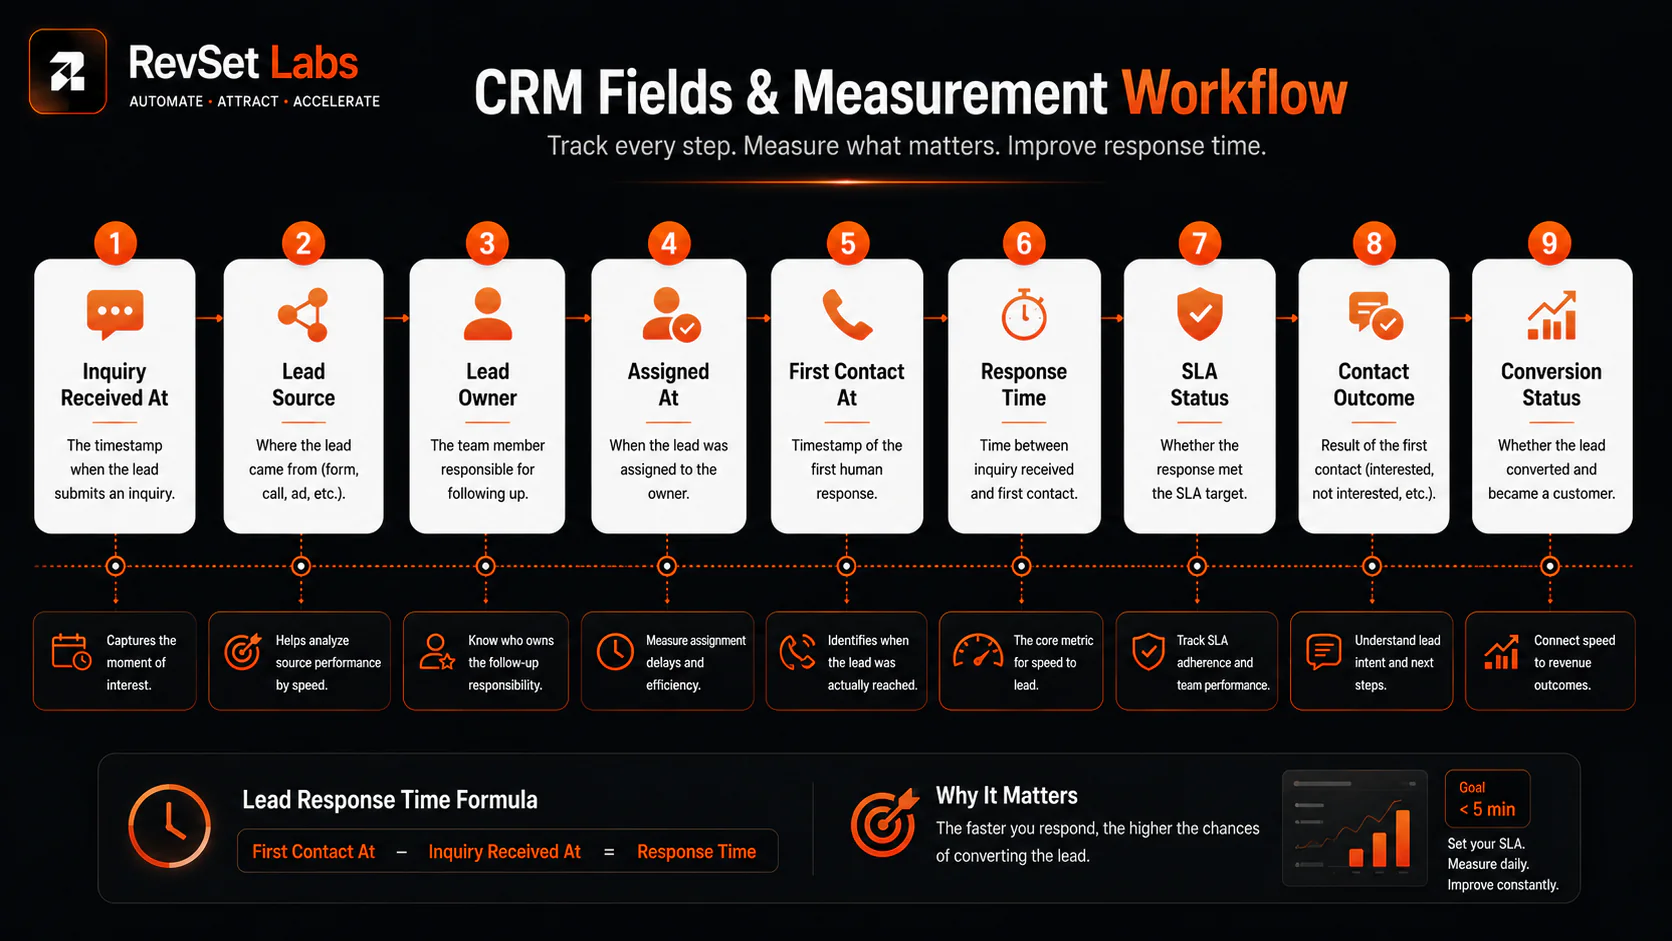
RevSet Labs Lead Response Fields
| CRM Field | Purpose |
| Lead Created At | Records when the lead entered the CRM or inquiry system. |
| Inquiry Received At | Records the actual customer inquiry timestamp when available. |
| Lead Source | Identifies where the lead originated. |
| Lead Owner | Shows who is responsible for the opportunity. |
| Assigned At | Records when ownership was assigned. |
| First Contact At | Records the first meaningful buyer-facing interaction. |
| Response Time | Calculates elapsed time between the start and stop timestamps. |
| SLA Target | Stores the expected response window. |
| SLA Status | Identifies whether the lead was contacted on time. |
| Contact Outcome | Records whether the prospect connected, missed the call, replied, etc. |
| Appointment Status | Shows whether the lead progressed to a scheduled next step. |
| Conversion Status | Connects response performance to the eventual business outcome. |
This structure gives revenue teams enough information to answer not only “How fast did we respond?”, but also:
“Did faster response actually produce better outcomes?”
That second question is where CRM reporting becomes commercially useful.
Define What Counts as First Contact
Many response-time reports fail at this point.
Let’s say a fresh lead is added to the CRM.
After five seconds:
- A workflow runs.
- The lead is assigned.
- A task is created.
- An internal Slack notification is sent.
There may now be several actions in your CRM.
However, the possibility has not received a response.
The response clock shouldn’t end on its own.
According to the customer’s experience, RevSet Labs advises defining a meaningful initial encounter.
Depending on your company, that may be:
- A successful phone call
- Customized sales email
- Two-way text message exchange
- A live chat reply
- meeting that was finished
- Another well-defined contact with the buyer
It is possible to follow automated acknowledgments independently.
They are helpful, but unless your company specifically identifies them as such, they shouldn’t be immediately seen as being on par with a human sales answer.
This distinction is especially crucial in CRM platforms, where response performance may appear better than what the client actually experienced due to system-generated activity.
Track Two Response Metrics, Not One
For most service businesses, RevSet Labs tracks two related metrics.
Automated Acknowledgement Time
This measures how quickly the system confirms that the inquiry has been received.
Example:
Lead submitted → automated SMS sent
Target:
30 seconds
This metric measures system responsiveness.
First Human Response Time
This measures how quickly a person actually engages the customer.
Example:
Lead submitted → sales representative calls
Target:
5 minutes
This measures sales responsiveness.
Keeping the two separate prevents businesses from reporting a fast automated acknowledgement as though a sales conversation had already begun.
How to Calculate Measure Lead Response Time CRM
There are several ways to calculate the metric depending on your CRM.
Simple Calculation
If both timestamps are available:
First Contact At − Inquiry Received At = Response Time
For example:
First Contact: 2:15 PM
Inquiry: 2:07 PM
Response Time = 8 minutes
For reporting purposes, store the result in minutes so the CRM can easily group and compare records.
How to Calculate Average Lead Response Time
Once individual response times have been calculated, the average is:
Average Response Time = Sum of All Response Times ÷ Number of Responded Leads
Example:
Five leads have response times of:
- 2 minutes
- 4 minutes
- 6 minutes
- 8 minutes
- 20 minutes
Average:
40 ÷ 5 = 8 minutes
The team has an average lead response time of 8 minutes.
But don’t stop there.
The average can hide serious operational problems.
Median vs. Average Lead Response Time
This is one of the most important reporting decisions.
Suppose your response times are:
2, 3, 4, 5, 6, 7, 8, 9, 10, 180 minutes
The average is heavily influenced by the 180-minute outlier. The median tells you what the typical lead experienced.
For that reason, RevSet Labs monitors:
- Median response time
- Average response time
- P90 response time
- SLA attainment
The median tells you what typical performance looks like. The average helps identify the effect of extreme delays. The P90 shows how long the slowest 10% of leads are waiting.
That last metric is particularly useful for operational teams because it exposes the leads that are falling through the cracks.
Why P90 Response Time Matters
Imagine your dashboard shows:
Median response time: 4 minutes
That sounds excellent.
But your P90 is:
96 minutes
That tells a very different story.
While a significant portion of leads encounter significant delays, the majority obtain prompt responses.
These delays might result from:
- After-hours questions
- Notifications that were missed
- Unassigned leads
- Issues with territory routing
- Availability of staff
- Failures in integration
- Leads coming in via unapproved channels
Rather than concealing such anomalies behind an appealing average, a robust lead response dashboard should highlight them.
How to Track Lead Response Time in HubSpot
Although HubSpot offers reporting tools and lead response capability, teams should fully comprehend the meaning of the metrics they have chosen before utilizing them as SLAs.
While its more comprehensive sales tools can also automate assignment, alerts, calling, scheduling, and follow-up, HubSpot records lead response functionality around the time it takes the current owner to create a qualifying interaction.
Your operational definition should be the first step in the practical setup for companies looking to measure lead response time in HubSpot.
A useful custom structure can include:
Inquiry Received At → Lead Assigned At → First Contact At → Response Time → SLA Status
RevSet Labs teams now have more control over what initiates and terminates the measurement.
Additionally, HubSpot offers sales reporting features and calculation characteristics that may be utilized to evaluate response performance and compare date-based variables.
How to Measure Lead Response Time in Salesforce
Although the execution will rely on your Salesforce configuration, objects, automation, and reporting setup, the same idea holds true for teams inquiring about how to monitor lead response time in Salesforce.
At minimum, create or capture:
- Lead Created Date
- Lead Assignment Date
- First Contact Date/Time
- Lead Source
- Lead Owner
- SLA Target
- SLA Met
- Contact Outcome
When a qualified buyer-facing event takes place, a Salesforce Flow may be utilized to fill a first-contact timestamp.
From the specified start and stop timestamps, the response-time value may subsequently be computed and shown in dashboards or reports.
The particular automation tool is not what matters.
It’s the data model.
Accurate historical measurement becomes challenging if the CRM does not maintain the initial inquiry time and the first meaningful contact time.
Build a Lead Response Time Report
Lead response time shouldn’t be treated as a single column in a generic sales report once your CRM data is accessible. This method conceals operational problems and makes it hard to identify the precise location of delays.
Instead, this is a specific RevSet Labs Lead Response Time Report that reflects the real flow of leads via your system, including capture, assignment, initial human contact, and outcome.
For a true operational perspective on response performance, we advise using this structure.
RevSet Lead Response Time Report (Operational View)
Date range:
Last 30 days (rolling window preferred for operational monitoring)
Lead status:
Only include valid inbound leads that represent real sales opportunities
Exclude:
- Spam or bot submissions
- Test or internal records
- Duplicate leads (keep earliest valid record only)
- Internal inquiries or employee submissions
- Recycled or reactivated legacy records (unless explicitly tracked as new intent)
This ensures the report reflects true customer demand, not CRM noise.
Report Grouping (Where Performance Breaks Down)
Segment the report according to operational factors rather than just reporting dimensions to make it actionable:
- Lead owner (the person in charge of speed-to-lead)
- Lead source (the area with the best or worst reaction performance)
- Location or region (time-zone problems and coverage gaps)
- Product line or service type (complexity affects response time)
- Day of the week (performance on weekdays versus weekends)
- Time of day (efficiency of personnel in real time)
The report becomes diagnostic instead of descriptive as a result of this categorization.
RevSet Labs Core Metrics (What Leadership Actually Needs to See)
| Metric | What It Tells You |
| Total Leads | Total inbound demand volume |
| Responded Leads | Leads that received a qualifying human response |
| Response Coverage | % of leads actually contacted (not just created) |
| Median Response Time | Typical real-world speed experienced by leads |
| Average Response Time | Overall efficiency (sensitive to delays) |
| P90 Response Time | Worst-case operational performance (leads falling through cracks) |
| SLA Met % | Compliance with defined response standards |
| Contact Rate | Whether speed is translating into actual conversations |
| Appointment Rate | Whether response speed is driving pipeline creation |
What This Report Actually Answers
This is where the RevSet Labs approach differs from standard CRM reporting.
This report is designed to answer operational questions, not vanity metrics:
- Where are response delays actually happening in the funnel?
(assignment, ownership, or first contact stage) - Which lead sources produce the fastest and slowest response behavior?
(not just highest volume) - Which reps or teams are consistently missing SLA thresholds?
(coaching + workload balancing insight) - Are after-hours and weekend leads being systematically delayed?
(staffing and routing gaps) - Is faster response actually improving downstream outcomes like contact rate and bookings?
(validates whether speed-to-lead is driving revenue or just activity)
RevSet Labs Insight
A properly built lead response report should not just tell you how fast you are responding.
It should reveal:
- where leads are getting stuck
- why response time varies
- whether speed is actually converting into revenue
If your CRM cannot answer those three questions, you don’t have a lead response report; you have a timing column.
This structure turns it into a real operational control system for speed-to-lead performance.
Lead Response Time Dashboard Setup
A useful dashboard shouldn’t overwhelm sales managers with dozens of charts.
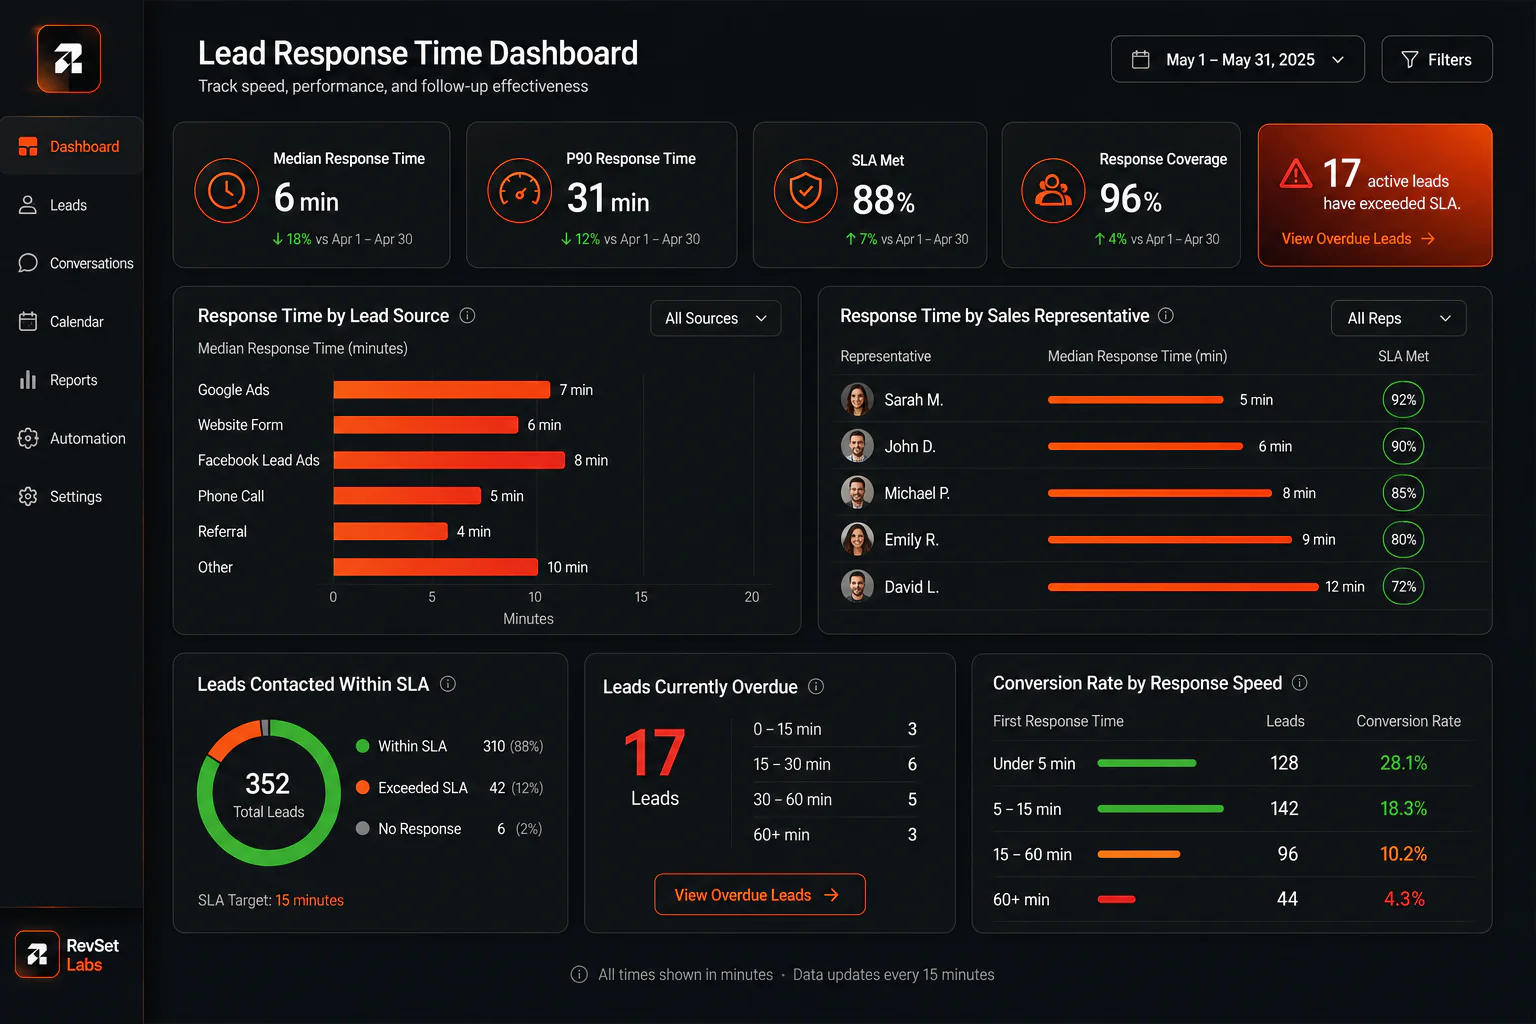
RevSet Labs has a simple operational dashboard with six core sections.
Add Response-Speed Buckets
One of the most useful additions to a lead response dashboard is a response-speed distribution.
Instead of reporting only one average, divide leads into groups:
| Response Speed | Leads | Contact Rate | Booking Rate |
| Under 5 min | 180 | 72% | 34% |
| 5–15 min | 96 | 64% | 28% |
| 15–30 min | 61 | 56% | 23% |
| 30–60 min | 39 | 47% | 17% |
| Over 60 min | 35 | 31% | 11% |
This kind of analysis is far more useful than just stating “average response time = 14 minutes.”
It enables the company to look into whether quicker response times are indeed linked to better contact and booking results.
At that time, speed to lead is no longer only an operations metric but also a revenue metric.
Connect Response Time to Conversion
In the end, a response-time dashboard should provide an answer to one query:
Do quicker responses result in better business outcomes?
To answer it, compare response-time groupings against:
- Contact rate
- Qualification rate
- Appointment rate
- Proposal rate
- Close rate
- Revenue per lead
For example, if leads reached within five minutes have a considerably higher booking rate than leads contacted after an hour, the firm has proof that response time is commercially relevant.
That doesn’t indicate response speed is the only source of the discrepancy.
Lead quality, source, service urgency, region, and other criteria may also impact results. But the link is worth studying.
Don’t Build a Dashboard Just to Look Fast
This is the point at which companies frequently make a mistake.
Leadership needs a figure, so they create a response-time dashboard. The team then prioritizes the quantity over the client experience. Because an automatic procedure started right away, a CRM may provide an answer in 10 seconds.
The performance appears outstanding on paper. The client is still awaiting a salesman. It’s not an improvement in operations. Measurement distortion is what that is.
RevSet Labs’ approach is simple:
- Measure what the customer actually experienced.
- Describe the beginning point.
- Describe the significant stopping point.
- Keep the timestamps intact.
- Keep automation and human interaction apart.
- Next, link conversion to response performance.
The dashboard becomes helpful after those foundations are established since it assists the team in identifying and resolving real income leaks.
A Practical CRM Implementation Checklist
Make sure your CRM can respond to the following queries before releasing your lead response report:
- What time did the query come in?
- Where did it come from?
- When was it assigned?
- Who is the owner?
- When did the first significant buyer-facing reaction take place?
- How many minutes have passed?
- Did the response fall inside the SLA?
- Did the potential customer participate?
- Was a scheduled appointment made?
- In the end, did the opportunity convert?
Don’t begin creating more charts if you can’t consistently respond to those queries.
First, fix the data structure.
Final Thoughts
Although the calculations are challenging, accurately measuring lead reaction time is not.
Businesses frequently disagree over what the measure truly implies, which makes it difficult.
The formula itself is straightforward:
First Contact Timestamp − Inquiry Timestamp = Lead Response Time
Creating trustworthy timestamps, establishing meaningful contact, automating data collection, and developing reports that highlight delays are the actual tasks.
It should be easy to determine not just how quickly your team replies, but also which leads are waiting, why they are waiting, and whether response time has an impact on conversion.
That’s how managing an activity differs from measuring a measure.
Creating the most attractive dashboard or claiming the quickest response time shouldn’t be the main objectives for the majority of service firms.
The goal should be to create a system that regularly collects, routes, contacts, and follows up on eligible leads.
FAQs
What is lead response time in a CRM?
The interval between a customer’s inquiry and the first significant effort to engage them is known as the lead response time. Reliable customer-facing timestamps should be used to measure it.
What is the formula for lead response time?
First Contact Timestamp − Inquiry Received Timestamp is the fundamental formula. This provides the precise amount of time a lead has to wait for a significant response.
Should automated messages count as a first response?
Not always. To prevent automation from making sales performance look faster than it actually is, RevSet Labs advises monitoring automated acknowledgement time independently from initial human response time.
Should automated messages count as a first response?
Track Inquiry Received At, Lead Owner, Assigned At, First Contact At, Response Time, SLA Target, and SLA Status, at the very least. Conversion and lead source data provide helpful context.
Is average response time enough to measure performance?
No. Extreme delays may be concealed by an average response time. Response coverage, SLA achievement, median, and P90 give a more accurate view of how leads really go through the sales process.
Can lead response time be measured in HubSpot?
Teams may examine the interval between assignment and qualifying interactions using HubSpot’s lead response reporting feature. What constitutes a relevant response should still be determined by your own operational definition.
Can Salesforce track lead response time?
Indeed. While assignment rules and automation can assist in capturing and routing new leads, Salesforce lead reporting can display the time it takes to respond to leads.
Why should response time be connected to conversion?
Commercially, speed only matters if it leads to better results. It is possible to determine whether quicker follow-up is indeed generating more revenue by comparing response-time buckets with contact, appointment, opportunity, and closing rates.
Turn Lead Response Time Into Revenue Performance
RevSet Labs assists companies in transforming lead response time from an uncertain CRM figure into a quantifiable revenue operations procedure.
This entails establishing the appropriate response-time model, organizing CRM information, enhancing lead routing, automating timestamps and notifications, creating practical dashboards, and linking response performance to conversion results.
The sales team might not be the issue if your existing CRM indicates that your staff reacts promptly, but your sales figures indicate otherwise.
The measuring system can be the cause. The issue becomes apparent with the correct data. It can be fixed with the correct workflow.
Use the RevSet Labs Revenue Leak Scorecard to evaluate your current lead management procedure and identify the most significant areas for improvement if you want to determine where quality leads are being overlooked, delayed, or improperly routed.